Analyzing LightSail-2 telemetry with Polaris
Polaris can help satellite operators to explore telemetry data using machine learning. Here's an example of a LightSail-2 analysis.


The 2019 edition of Open Source Cubesat Workshop is rapidly approaching. I will be traveling to Athens this weekend to present Polaris next Monday in a talk titled "Toward autonomous satellite operations and monitoring using machine learning", but before that I wanted to share a sneak peek of what we've achieved during the past months.
As I've explained in previous posts, Polaris is split into three different commands: fetch, learn and visualize. Only when having the three of them working, or at least the basics, we can start playing with real data and see analysis results. This week we completed the very important milestone of running the complete pipeline for the first time.
For now we just support the LightSail-2 spacecraft for several reasons. We think it's a really interesting project; it has a fairly amount of telemetry; we have all the information needed to decode and normalize the frames, and last but not least, Hugh, one of the mentors of Polaris, is a member of the Planetary Society. But let's get to the code, this is how Polaris works:
polaris fetch
$ polaris fetch -s 2019-08-10 -e 2019-10-5 LightSail-2 /tmp/As you can see, we have to specify the data interval we are interested in, the satellite name (NORAD ID is valid too) and finally the location of the output file. The command retrieves raw telemetry data from the SatNOGS network, decodes it and finally normalizes it. The output would look something like this:
$ head /tmp/normalized_frames.json
{
    "metadata": {
        "data_format_version": 1,
        "satellite_norad": "44420",
        "satellite_name": "LightSail-2"
    },
    "frames": [
        {
            "time": "2019-09-12 08:14:42",
            "measurement": "",
            "tags": {
                "satellite": "",
                "decoder": "Lightsail2",
                "station": "",
                "observer": "",
                "source": "",
                "version": "0.16.1"
            },
            "fields": {
                "dest_callsign": {
                    "value": "N6CP  ",
                    "unit": null
                },
                "src_callsign": {
                    "value": "KK6HIT",
                    "unit": null
                },
                "src_ssid": {
                    "value": 2,
                    "unit": null
                },
                "src_ip_addr": {
                    "value": "129.65.147.35",
                    "unit": null
                },
                "dst_ip_addr": {
                    "value": "224.0.0.1",
                    "unit": null
                },
                "daughter_atmp": {
                    "value": 20.0,
                    "unit": "degC"
                },
                "daughter_btmp": {
                    "value": 19.0,
                    "unit": "degC"
                },
                "threev_pltmp": {
                    "value": 20.5,
                    "unit": "degC"
                },
                "rf_amptmp": {
                    "value": 26.0,
                    "unit": "degC"
                },
polaris learn
$ polaris learn -g /tmp/new_graph.json /tmp/normalized_frames.jsonThis command needs to know which data to analyze and where to save the output graph. It's the core of the project and it uses XGBoost to obtain a dependency matrix (finds relationships between telemetry parameters). It can also calculate feature (i.e. parameter) importances but as of yet, there's no way to display them in polaris viz.
There are tons of ideas to enhance the learning part, but just with this we can already see some interesting results. Keep reading!
polaris viz
$ polaris viz /tmp/new_graph.json
2019-10-10 09:44:40,312 - polaris.data_viz.server - INFO - Serving ready: http://localhost:8080
To run last command we just needs to indicate where to get the graph information that had been obtained in the learning process. All it does is starting a web server and display the information using D3.js. When opening your web browser, you should see something like this:
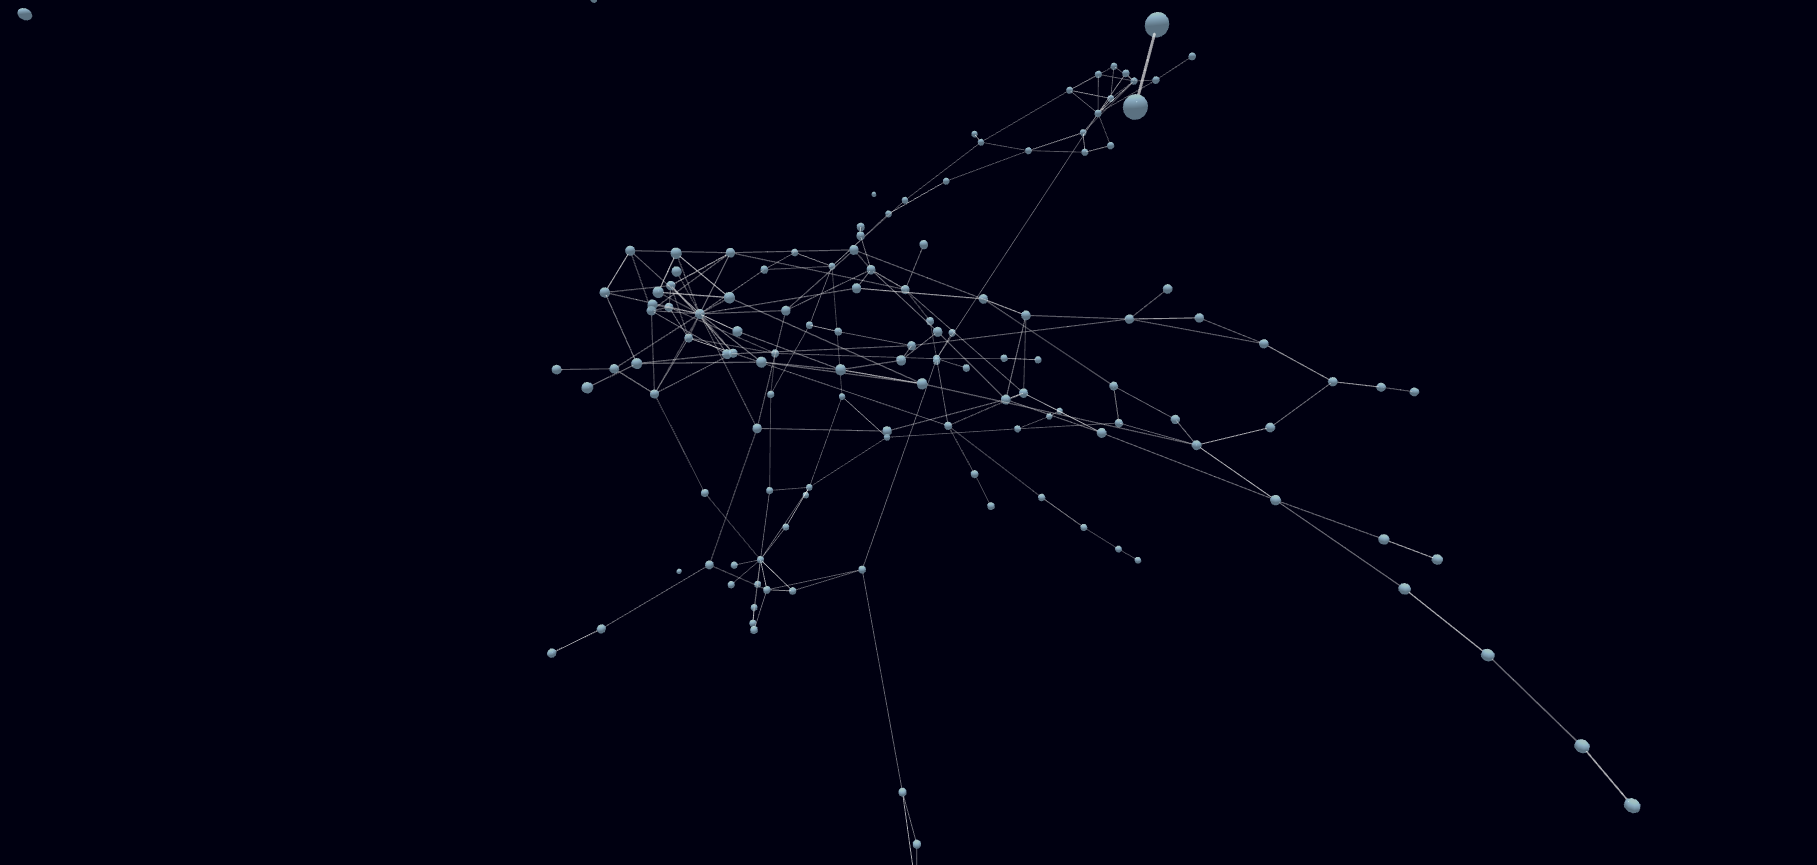
We are now analyzing the output, but we've already found some hints that indicate that data is makes sense. For instance, there are several clusters. One of them groups the cpu_usage (idle, sys and user), nand_erasures, tx/rx_byte_count, beacon_count. There's another cluster with temperature and power nodes... These are preliminary results but fun has just begun. My colleagues Red and Patrick have put the results of this example in a server so that everyone can take a look at them. Go to https://deepchaos.space/ to check it out.
That's it for this blog post. As always, if you want to know more about the project make sure you join our public Riot room. Finally, if you want to try Polaris yourself, visit our GitLab repo.